Which Cities Have the Best-Performing Office Markets Exiting the Pandemic?
By Greg Cornfield April 26, 2022 6:10 pm
reprints
UPDATED: As a growing number of office users adopt hybrid work models, national investment sales and rental rates both dropped in the first three months of this year compared with the same period in 2021.
U.S. office sales hit $18.9 billion in the first quarter, with the national average price at $280 per square foot, according to a new report by CommercialEdge. Last year, there was about $22 billion in investment sales in the same period.
More than $7.5 billion of this year’s total came in six leading markets, each of which logged more than $1 billion in sales so far this year: Seattle, Dallas, New Jersey, Houston, the San Francisco Bay Area and Manhattan. Manhattan was far and away the most expensive city for investment sales, averaging $921 per square foot in the first quarter.
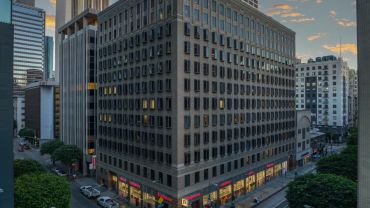
Los Angeles was just shy of $1 billion in office sales, totaling $998 million in the first three months of the year. The entertainment industry continues to spur investments in a city where office-using employment is lagging, according to Commercial Edge. The city’s top deal year to date was the $93 million sale of the Netflix-occupied office in Hollywood.
National office listing rates averaged $38.65 per square foot per year in March. That’s down 2.6 percent compared to last year. On the positive side, Miami and Charlotte, N.C., registered some of the highest gains over the past year, with rates rising 12.2 percent and 10.7 percent, respectively.
On the other hand, San Francisco’s $63.04 listing rate was the second-highest nationwide, but also marked a 9.5 percent drop year over year. Manhattan’s $74.20 rate was 13.5 percent lower than one year ago.
The national office vacancy rate hovered at 15.9 percent across the largest 50 U.S. markets, which was an increase of 30 basis points compared with the same period last year. Vacancies in San Francisco grew from a pre-pandemic 7.3 percent to 17.3 percent in March 2022. Boston’s 10.5 percent, Portland, Ore.’s 12.3 percent and Miami’s 12.8 percent vacancy rates were the tightest of the top 50 cities.
The shift to remote and hybrid work also led to a smaller pipeline of new supply last year. In 2019, crews started building 86.4 million square feet of new office space. That figure dropped to 58.4 million in 2020, and inched up to 63.1 million in 2021.
Everything is getting bigger in Texas too. In 2021, Austin and Dallas led the country in new office starts, combining for 9.8 million square feet under construction. Austin accounted for 10 million square feet of office space under construction this year, representing 11.5 percent of its existing stock, while planned projects totaled 25.3 percent of the city’s current stock — the highest share among top markets in the nation.
Of all the projects under construction across the country, 93 percent will be at least Class A space. If this trend continues, many owners of Class B and C buildings may feel the squeeze and look for conversion opportunities, according to CommercialEdge.
“We expect that those exploring conversions will be looking at life sciences, multifamily and, to a lesser extent, industrial,” the report reads.
Markets with a heavy concentration of jobs in the life sciences also saw new development break ground throughout the pandemic. Besides Austin and Dallas, four of the remaining seven top markets for construction starts in 2021 were all life sciences hubs, including San Francisco and the Bay Area, Boston and Raleigh-Durham, N.C.
Gregory Cornfield can be reached at gcornfield@commercialobserver.com.