Midtown Vacancy Is Higher Than Midtown South and Downtown
Strong demand from the tech and creative firms led to leases in Midtown South and Downtown for value-minded tenants
By Richard Persichetti November 8, 2017 10:56 am
reprints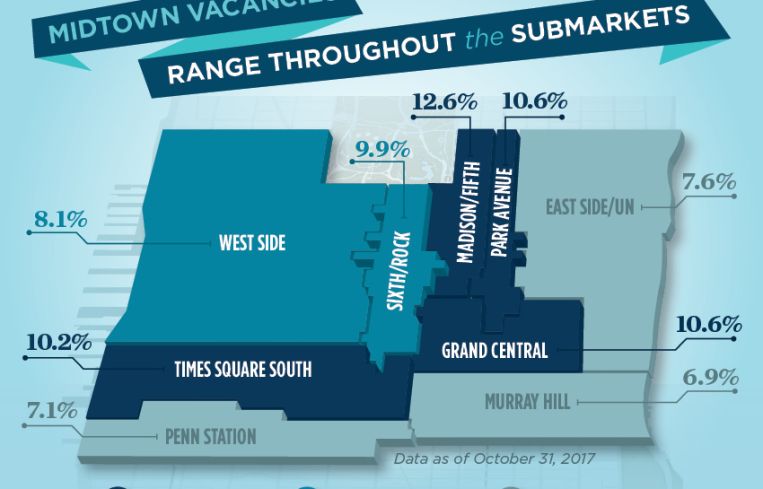
At 9.6 percent, Midtown vacancy has maintained a higher rate than both Midtown South’s 7 percent and Downtown’s 8.5 percent every month in 2017 through October. The strong demand in recent years from the tech and creative firms in Midtown South and the migration to Downtown for value-minded tenants has leveled the playing field for all three markets. Although Midtown vacancy is up only 10 basis points from one year ago, let’s examine how the vacancies range within the nine Midtown submarkets by grouping them with vacancies above 10 percent, from 8 to 9.9 percent and below 8 percent.
Above 10 Percent
Surprisingly, some of the most historically coveted Manhattan submarkets have the highest vacancies in Midtown, and these submarkets also account for 72.3 percent of the $100-plus work allowances offered this year.
Madison/Fifth – The most expensive submarket also has the highest Midtown vacancy rate at 12.6 percent, and is up year-over-year by 60 basis points despite dropping as low as 11.1 percent in December of 2016.
Grand Central – The largest submarket has the second-highest vacancy rate, and at 10.6 percent it has increased 40 basis points since one year ago.
Park Avenue – This submarket recovered from earlier this year when vacancy reached a recent high of 13.1 percent in April and is 40 basis points lower than one year ago at 10.6 percent.
Times Square South – After reaching a low of 7.6 percent in April, vacancy steadily increased the last six months to 10.2 percent and is 60 basis points higher than in October 2016.
8 to 9.9 Percent
Only two submarkets fell within this midrange for vacancy rates, and both are susceptible to significant move-outs over the next three years.
Sixth Avenue/Rock Center – At 9.9 percent, vacancy is at an 11-month low but still remains 130 basis points higher than one year ago.
West Side – Vacancy in this submarket is down 130 basis points to 8.1 percent year-over-year and remained in the 7.9 percent to 8.1 percent range in nine of the 10 months in 2017.
Below 8 Percent
The three Midtown submarkets with the lowest vacancy rates all have different catalysts for the limited supply.
East Side/U.N. – Vacancy was as low as 5.5 percent at the end of 2016, due to lower than average market rents, but jumped up to 7.6 percent this year and is 170 basis points higher than one year ago.
Penn Station – The flight to new construction and redeveloped properties on the Far West Side certainly assisted this submarket’s vacancy rate this year. Penn Station posted the largest year-over-year decrease, down 290 basis points to 7.1 percent.
Murray Hill – The smallest Midtown submarket also has the lowest vacancy rate and overall asking rents. At 6.9 percent, vacancy is 120 basis points lower than it was in October 2016, which is attributed to its proximity to Midtown South.


