CRE CLO Distress Rates Seesaw Back Above 13%
Following a dramatic reduction, the commercial real estate collateralized loan obligation (CRE CLO) market saw its distress rate rise by 80 basis points (bps) to 13.2 percent in May, according to CRED iQ’s latest data. Originations in the sector continue to be robust, so the picture is murky at best.
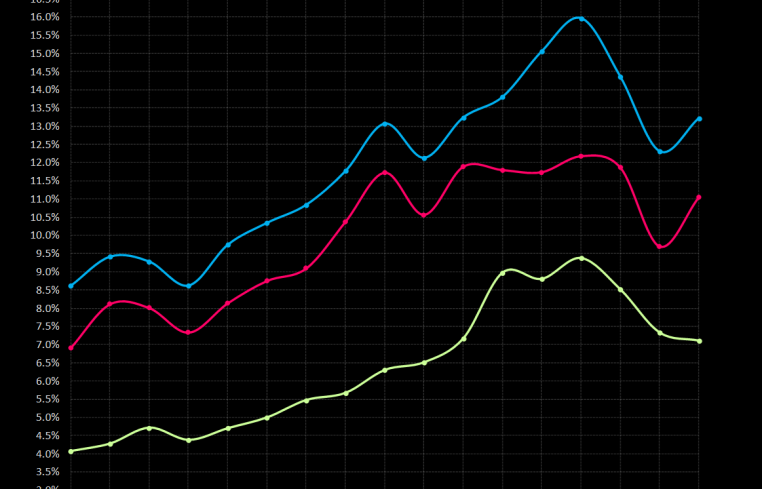
Investors hoping for a third consecutive reduction in the CRE CLO distress rate were left a bit disappointed as the benchmark added 80 bps to close at 13.2 percent in the May report.
The underlying metrics were mixed, with the special serving rate shaving off 30 bps to 7.1 percent while the all-important delinquency rate added 130 bps, bringing it to 11 percent.
Similar to last month’s data, our research team widened the aperture a bit to examine the velocity of the CRE CLO sector over the past year.
Total year-to-date CRE CLO issuance totals $10.5 billion across 11 deals. As a comparison, during the first four months in 2024, CRE CLO volume totaled only $2.2 billion (across three deals), meaning CRE CLO issuance velocities have increased 377 percent compared to last year. (Indeed, as we approach summer, it could be argued that CRE CLO issuance is already hot.)
Looking across a wider analysis of payment status reveals ongoing challenges. 64.4 percent of CRE CLO loans have surpassed their maturity date (up from 63.1 percent last month). More than a third (36.6 percent) are classified as “performing matured” — down from 37.3 percent. This suggests that many borrowers are exercising extension options or negotiating month-to-month arrangements to avoid default.
Precisely half (50 percent) of CRE CLO loans have surpassed their maturity date and are not performing, which is a record. This metric was 25.6 percent in our January print. May’s data showed that 14.3 percent of CRE CLO loans are current — down from 16.8 percent last month. Delinquent Loans (pre-maturity) account for 21.3 percent, which is the third consecutive month-over-month increase.
These figures reflect a market grappling with the aftermath of loans originated in 2021 and 2022, when cap rates were compressed, valuations were elevated, and interest rates were historically low. Many of these loans, structured with floating rates and three-year terms, are now hitting maturity walls in a dramatically different economic environment.
Case study: Norterra Canyon Apartments
A real-world example illustrates the pressures facing CRE CLO borrowers. The $58.6 million Norterra Canyon Apartments loan, backed by a 426-unit multifamily property in Las Vegas, highlights maturity-related challenges. The loan was added to the servicer’s watchlist in November 2024 due to pending loan maturity. Set to mature in May 2025, the loan transitioned to non-
performing mature status in May 2025.


