A Tale of Two Cycles and What It Means for the 2024 CMBS Marketplace

CRED iQ analyzed recent loans issued this year and compared them to loans from a decade earlier. Our analysis compared underwriting of the same asset for two different loans during two different commercial real estate cycles. One was in 2011, fresh out of the great financial crisis of 2008/2009, and the most recent was issued in December 2023.
This week’s tale has special significance when we look closely at today’s CMBS marketplace. The latest new issuances this year feature a predominance of refinancing transactions, which accounted for 79 percent of the loan activity across 2024 new issuances thus far, with recapitalization taking on another 7.5 percent. Only a relatively modest 12.9 percent of the underlying loans represented acquisitions. Refinance and recapitalizations totaled approximately $5.6 billion, while acquisition volume was only $827 million.
Now let’s compare two loans on the same Fort Lauderdale property — one in 2011 and the second from four months ago in December 2023.
Property
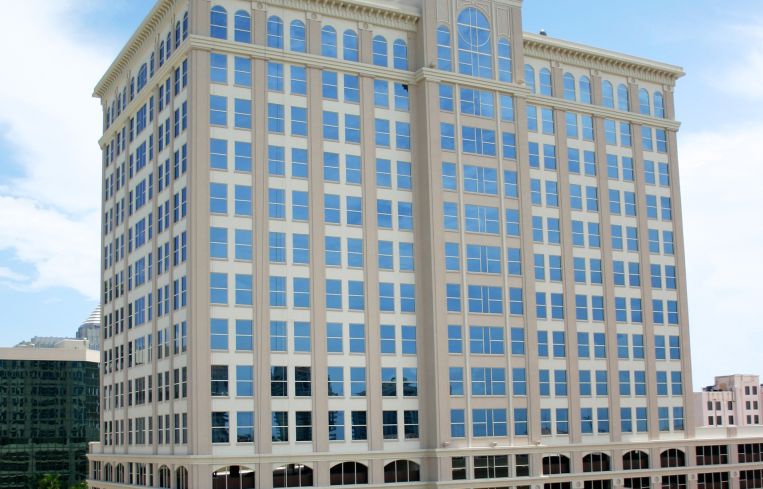
200 Southwest First Avenue is a 17-story, Class A office tower containing 205,956 square feet in downtown Fort Lauderdale built in 2007. The property, which is often referred to as the AutoNation building, originated at high occupancy rates of 88.1 percent and 91.4 percent in 2011 and 2024, respectively.
2011 Loan
In January of 2011, the loan was originated with a 5.572 percent interest rate on an appraised value of $71.3 million ($346 a square foot), an underwritten cap rate of 6.7 percent and a loan to value (LTV) of 61.6 percent. The balloon structure carried a maturity date of April of 2018 and included mezzanine debt of $6 million. Average rents based on the 2011 rent roll were $19.81 a square foot, which is significantly lower than today’s average rent of $28.03, a 41.5 percent increase.
2024 Loan
In December of 2023 an interest-only loan was originated at an 8.25 percent interest rate with a five-year term. The issuance appraised value was $102.5 million ($498 a square foot). The underwritten cap rate was 6.3 percent with an LTV of 53.7 percent and a maturity date of December 2028. Underwritten debt service coverage ratio was 1.33 times compared to the 2011 underwriting of 1.48 times. The newer loan’s interest rate is 270 basis points higher than the 2011 loan.
Understanding how loans are refinancing are key to forecasting in this new market. For most borrowers and investors, it is indeed a tale of two cycles.
Mike Haas is founder and CEO of CRED iQ.


