Stat of the Week: 13.4 to 7.9
Manhattan Office Market Stat Bowl V
By Richard Persichetti February 2, 2018 6:24 pm
reprints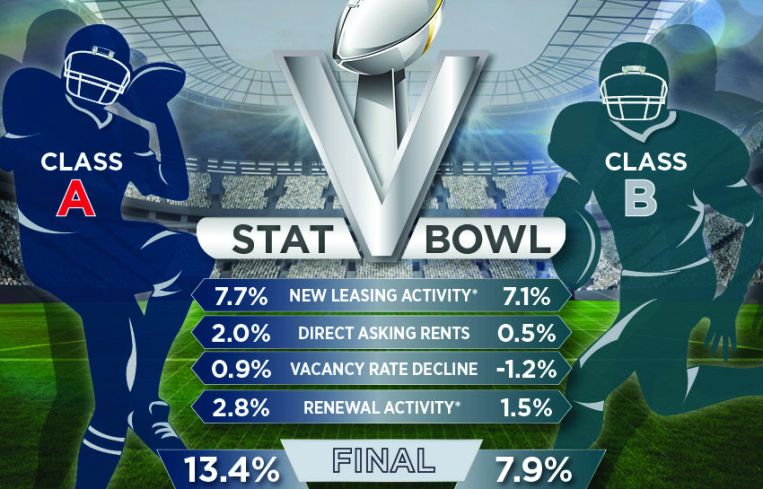
It’s time for Super Bowl Sunday, and that can only mean three things: Over 110 million people will turn on their TVs and watch the big game; more than 1.3 billion chicken wings will be consumed; and it’s time for the fifth annual Manhattan Office Market Stat Bowl.
When this Stat Bowl started, the Manhattan office market was value-oriented as Class B space outperformed Class A for the first two meetings. With new development on the horizon, a shift to new space and a flight to quality occurred as Class A space won the last two years in a row. Now let’s see if Class A is able to do the unthinkable and attain that unreadable three-peat and win for the third consecutive year.
The Stat Bowl kicks off with a comparison of new leasing activity as a percentage of the market size for Class A and B space. In 2017, more than 20.3 million square feet of Class A new leases were signed, which equals 7.7 percent of the total inventory. Class B performed well, too, as more than 7.1 million square feet of new leases were completed, comprising only 7.1 percent of its total inventory. This puts Class A in the early lead by a score of 7.7 percent to 7.1 percent to end the first quarter.
The second quarter scoring will be based on the percentage change for direct average asking rents. Despite a dip in the fourth quarter of 2017, direct Class A rents increased 2 percent over the year to $82.47 per square foot. Class B direct asking rents increased as well but only by 0.5 percent to $62.45 per square foot. This puts Class A space in the lead headed into halftime by a close score of 9.7 percent to 7.6 percent.
The third quarter will be decided on the largest decline in the vacancy rate. Class A space dropped 0.9 percentage points to 9.1 percent in 2017—the lowest level in 107 months. Class B committed a penalty on this stat, as the vacancy rate increased in 2017, up 1.2 percentage points to 9 percent. The third quarter ends with a score of 10.6 to 6.4.
The fourth quarter comes down to lease renewals as a percentage of the market size, where Class A totaled 7.2 million square feet—2.8 percent of its total inventory. Class B renewals came in at 1.5 million square feet but equaled only 1.5 percent of the inventory. This makes Class A the Super Stat Bowl champion by a score of 13.4 to 7.9 and marks the first ever three-peat champion. Although I think there will be a lot more scoring in Super Bowl LII, I am picking the New England Patriots to defeat the Philadelphia Eagles, only because I picked the Patriots to lose their last two trips to the big game, and I need to use some reverse juju this year.


