Stat of the Week: 7 Submarkets
By Richard Persichetti April 26, 2017 1:11 pm
reprints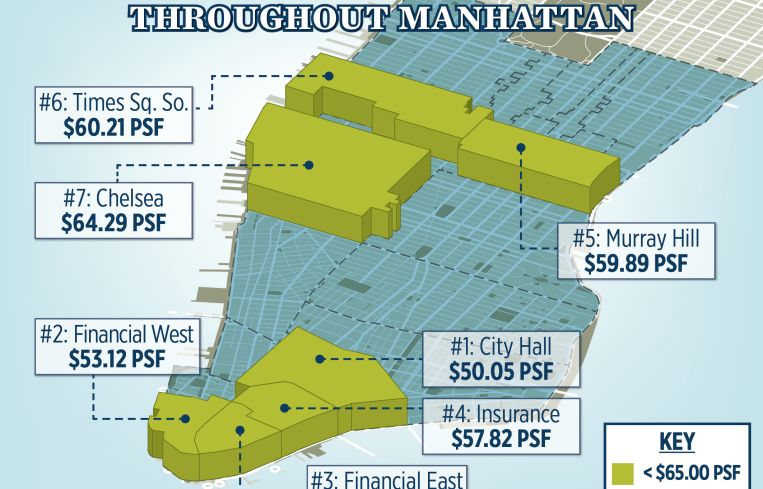

7. Chelsea – The only Midtown South submarket of the group is right on the cusp of leaving its value title behind, and with a $64.29 per square foot average, it could happen as soon as next month. Chelsea also had the largest year-over-year rental increase of the seven value submarkets, up 7.7 percent.
6. Times Square South – One of two Midtown value submarkets, Times Square South overall asking rents average $60.21 per square foot and have been on the decline over the past 12 months, down 4.7 percent.
5. Murray Hill – The second of the two Midtown value submarkets dropped 3.6 percent to $59.89 per square foot over the past year and is below $60 per square foot for the first time in two years.
4. Insurance – Downtown owns four of the seven value submarkets, but each of them had year-over-year increases in overall asking rents. Insurance ranked the highest with a $57.82 per square foot average, up 3 percent from one year ago.
3. Financial East – This submarket owns the largest rise in asking rents of the Downtown submarkets, up 4.9 percent year-over-year to $56.18 per square foot.
2. Financial West – Despite having the highest vacancy rate of all 20 Manhattan submarkets, overall asking rents are up 2.7 percent since one year ago to $53.12 per square foot.
1. City Hall – This submarket has the lowest overall average asking rent in Manhattan, at $50.05 per square foot. Despite an 8.7 vacancy rate, 63.8 percent of the available space is located in one building, 375 Pearl Street.


