Stat of the Week: 17 Submarkets for ’17!
By Richard Persichetti January 4, 2017 5:33 pm
reprints
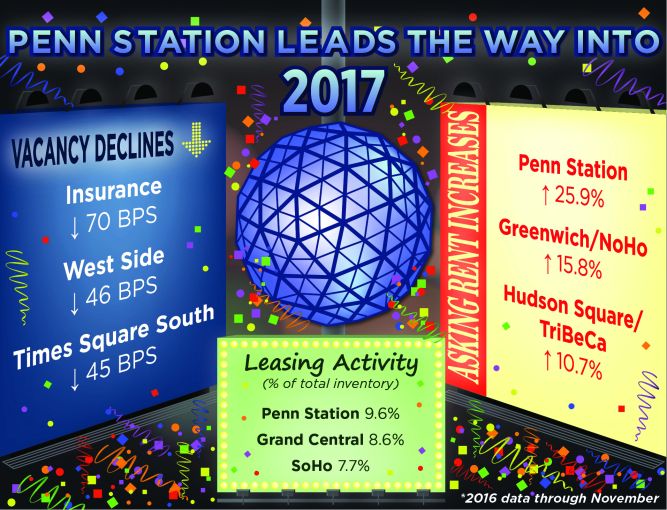
In the spirit of the New Year, let’s review how the 17 submarkets performed last year as we ring in 2017. Although Cushman & Wakefield tracks 19 Manhattan submarkets, I combined three of them to make up the “Plaza District”—Park Avenue, Fifth/Madison Avenues and Avenue of the Americas/Rockefeller Center—in order to analyze 17 for 2017. Methodically examining the largest decline in vacancy, the highest overall asking rent increase and the greatest amount of new leasing activity as a percentage of the total submarket inventory should reveal the strongest submarket of the year (based on data through November). So, let’s review the top three submarkets for each category.
Vacancy Decline
Vacancy slowly crept up in 2016 throughout Manhattan, up 80 basis points through November to 9.3 percent, and increased in 12 of the 17 submarkets. Of the five submarkets with a vacancy decline, insurance led them with a 70-basis-point drop to 9 percent. The West Side had the second-largest decline, down 46 basis points to 9.2 percent, followed by Times Square South with a 45-basis-point drop to 9.6 percent.
Overall Asking Rent Increase
Despite vacancies rising throughout Manhattan, overall average asking rents were up in 2016—1.8 percent to $72.86 per square foot. Overall average asking rents increased in 11 of the 17 submarkets, with Penn Station’s average skyrocketing 25.9 percent to $77.13 per square foot, due to the construction of construction at 10 Hudson Yards. Midtown South rounds out the top three as Greenwich/Noho asking rents jumped 15.8 percent to $75.47 per square foot and Hudson Square/Tribeca pricing increased 10.7 percent to $77.21 per square foot.
Leasing Activity (as a Percentage of Total Inventory Size)
New leasing activity reached 24.1 million square feet through November, and despite being 7.6 percent off from 2015 totals, it is still on pace to surpass the historical average of 26.1 million square feet. Looking at leasing activity by submarket as a percentage of its total inventory size, Penn Station had the highest activity as 9.6 percent of its inventory was leased. The majority of leasing was from the buildings under construction in Hudson Yards, as 81 percent of the 2.1 million square feet leased was from new and future inventory. Grand Central Terminal and Soho round out the top three, with 8.6 percent and 7.7 percent of their inventories leased in 2016, respectively.
As Penn Station takes the top spot in two out of three categories, it heads into 2017 as the submarket with the most momentum. Cheers to a new year!


