Stat of the Week: 2016 Versus 2012
By Richard Persichetti August 10, 2016 9:05 am
reprints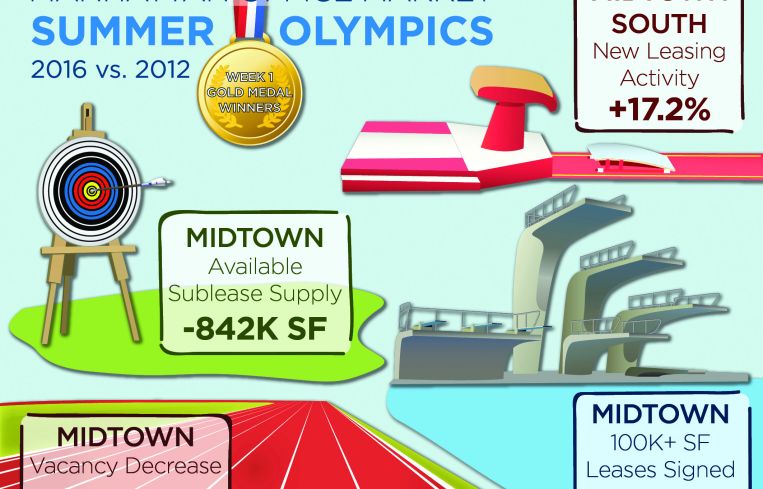
In honor of the Summer Olympics, I thought it would be a good time to do a comparison of the Manhattan office market using data from 2016 versus the year of the 2012 summer games. Over the next two weeks, Midtown, Midtown South and Downtown will compete in nine events and be awarded a gold, silver or bronze medal based on its performance for each statistic. This week’s events will focus on supply and demand statistics. So, now that the torch is lit, let the games begin!
The first event will be decided by the change in vacancy rate from July 2012 to July 2016. Midtown runs away with the gold, as it is the only market with a decrease in vacancy, down 50 basis points to 9.5 percent. Midtown South edges out Downtown in a photo finish for the silver with a 57-basis-point increase to 6.6 percent over this time period compared with a 63-basis-point increase to 9.7 percent for Midtown South.
Midtown South misses the target in the second event and barely holds onto the bronze medal, as it is the only market with an increase in the sublease supply compared to four years ago—up 55.1 percent to just over 1 million square feet available. Midtown hits the bullseye and wins gold again, shedding almost 842,000 square feet of sublease space, while Downtown just misses the mark and disposes more than 612,000 square feet to win the silver.
The third event starts the demand categories, as new leasing activity is compared through July 2016 versus July 2012. Midtown South springboards its way to a gold with a 17.2 percent increase in new leasing activity. Midtown grabs the silver with a 12.5 percent increase, while Downtown stumbles its way to the bronze with a 38.5 percent decrease in leasing activity.
The fourth event covers the difference in leases and renewals signed greater than 100,000 square feet between the two time periods. Midtown dives into the gold for this event with 17 large lease transactions completed this year compared to only 11 through July in 2012. Midtown South was synchronized for the two time periods with five leases completed. Downtown unfortunately splashes into the Olympic pool on this event with only four completed in 2016 compared to 12 in 2012.
Next week I will wrap up the Manhattan Summer Olympics with five more event and a tally of the medals.


