Stat of the Week: Midtown Madness II, 10.5 Percent
By Richard Persichetti April 6, 2016 9:15 am
reprints
Last week during the first round of the Midtown Madness tournament, the Penn Station submarket failed in its quest to repeat as champion, while the third-seeded West Side scored the only upset. With the final four set, it is time to find out who is the 2016 Midtown Madness champion!
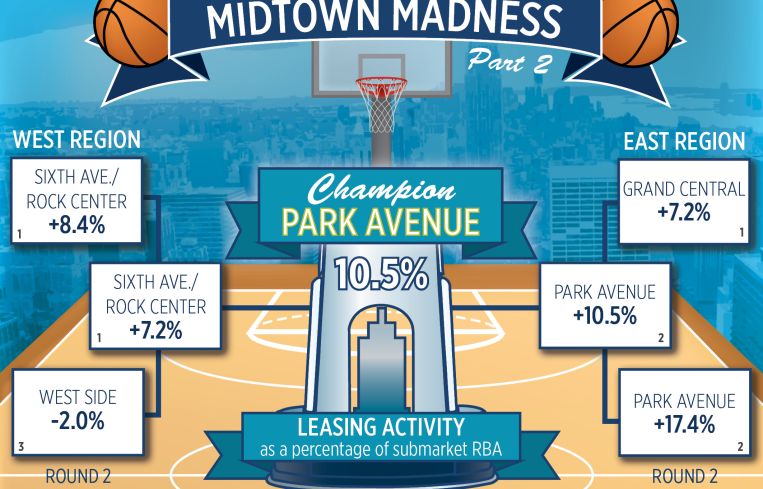
The second round will be decided by the largest increase for Class A direct average asking rents. In the East region, No. 1-seeded Grand Central posted a 7.2 percent increase over the past year to $70.42 per square foot. However, No. 2-seeded Park Avenue scores the upset to start the second round with a 17.4 percent increase in the last 12 months to $107.54 per square foot.
In the West region, the top-seeded Sixth Avenue/Rock Center submarket starts off with a solid 8.4 percent increase in Class A direct asking rents to $92.32 per square foot. This was too much for the No. 3-seeded West Side, as Class A direct asking rents actually dropped 2 percent in the last year to $78.25 per square foot, mostly because of significant leasing activity at 1633 Broadway. So, the stage for the finals is set: It will be the No. 1-seeded Sixth Avenue/Rock Center submarket from the West region versus the No. 2-seeded Park Avenue from the East region.
The Championship game will be decided by total leasing activity over the last 12 months as a percentage of the total submarket size. The Sixth Avenue/Rock Center submarket had over 2.8 million square feet of leasing activity over the last 12 months, while Park Avenue totaled over 2.2 million square feet. But since Park Avenue is a significantly smaller submarket, its leasing activity accounts for 10.5 percent of the total inventory compared to only 7.2 percent of Sixth Avenue/Rock Center’s activity.
This makes Park Avenue the 2016 Midtown Madness champion


