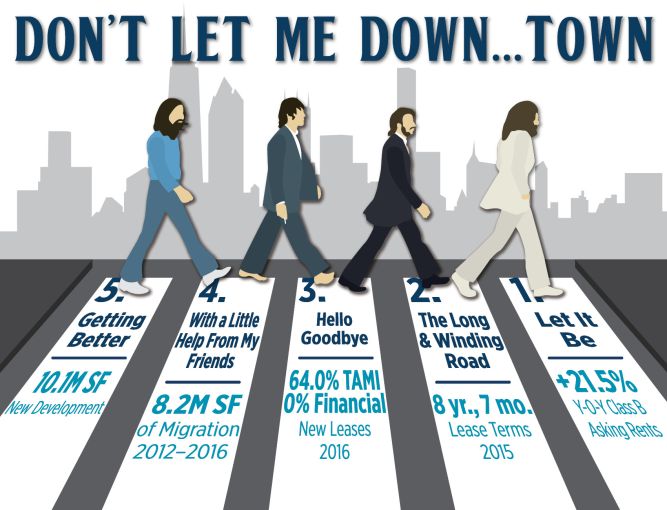
With last week’s passing of the “Fifth Beatle,” George Martin, I thought a good tribute would be to create a Beatles-themed Stat of the Week. In keeping with the Downtown issue, the following market statistics will be based off of the performance of the Downtown office leasing market, in concert with five Beatles songs. So, to set the proper tone of this week’s article, let’s start off with Don’t Let Me Down…town.
5. Getting Better—New construction and infrastructure, I have to admit, it is getting better all the time. With the combination of over 10.1 million square feet of new and future office development and the Calatrava PATH station opening earlier this month. Downtown certainly is getting better.
4. With a Little Help From My Friends—Midtown and Midtown South are sending tenants Downtown’s way. Since January 2012, over 275 tenants totaling more than 8.2 million square feet of space have migrated to the Downtown market.
3. Hello, Goodbye—Hello, TAMI (tech, advertising, media and information services): Goodbye, financial services. Through the first two months of 2016, TAMI accounted for over 64 percent of the new leases signed greater than 10,000 square feet, while the financial services sector had zero.
2. The Long and Winding Road—Downtown had the longest lease terms, in years, of the three markets in 2015. Tenants went long on Downtown leases in 2015 and signed deals with an average lease term of eight years and seven months, compared to seven years and nine months in Midtown and seven years and one month in Midtown South.
1. Let it Be—Class B, that is! Downtown Class B space is outperforming Class A, with overall asking rents up 21.5 percent to $49.88 per square foot in the past year. Downtown leasing activity is up 84.6 percent in the first two months of 2016 in comparison to 2015, and at 5.9 percent, the vacancy rate is below 6 percent for only the second time in recorded history.


