Stat of the Week: 400-bps Drop
By Richard Persichetti February 24, 2016 9:45 am
reprints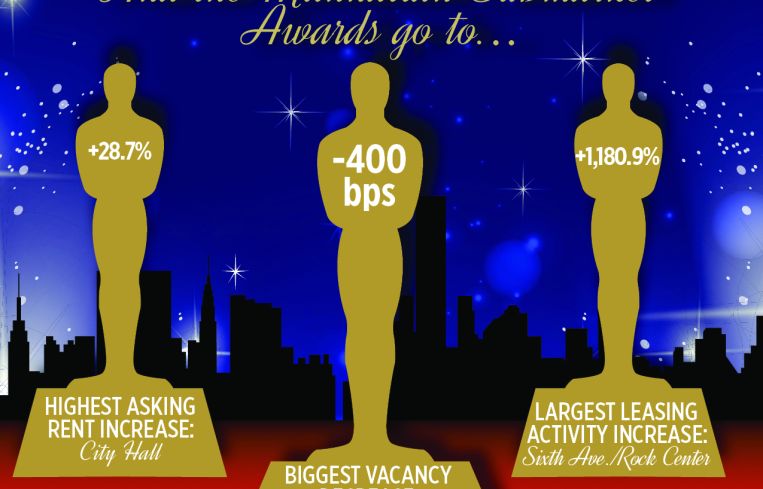
With the 88th Academy Awards set for Sunday, Feb. 28, it’s time to celebrate the top Manhattan submarket performers over the past 12 months. I have to be honest: I am stunned Star Wars: The Force Awakens was not nominated for Best Picture. It was the only movie I saw in the theater this past year—three times to be exact. Since I have not seen any of the 2016 nominees for best picture this year, I will stick to the Manhattan real estate market. So, without further ado, here are the three categories for best year-over-year performances through January.
The first category is the largest percentage change in new leasing activity for a submarket, comparing January 2015 to January 2016. Let’s review the top three nominees:
• Insurance had leasing activity totaling only 26,828 square feet in January 2015, which soared to 120,231 square feet this January.
• Sixth Avenue/Rock Center had the most new leasing activity this January with 463,238 square feet completed, compared to 36,164 square feet in January 2015.
• Finally, the World Trade submarket had new leasing activity leap from 47,636 square feet in January 2015 to 258,399 square feet in 2016.
And, with a 1,180.9 percent increase, the award goes to…. Sixth Avenue/Rock Center submarket!
The second category is the highest percentage increase in overall asking rents for a submarket year-over-year. The nominees are:
• City Hall overall average asking rents skyrocketed from $48.61 to $62.56 per square foot.
• The Insurance submarket, with its second nomination of the article, had overall average asking rents increase from $44.94 per square foot to $56.27.
• The last nominee for this category, the Hudson Square/West Village submarket, had overall asking rents jump from $61.13 to $76.59 per square foot.
And, with a 28.7 percent increase in asking rents, the award goes to… City Hall!
The final category is the highest basis point decrease in vacancy for a submarket year-over-year. Let’s review the top three nominees.
• Chelsea vacancy tightened more over the last 12 months from 7 percent to 5.2 percent.
• With its third nomination, the Insurance submarket vacancy rate dropped from 11.3 percent to 9.1 percent.
• And finally, the Greenwich/Noho submarket had a stunning vacancy decline from 6.7 percent to 2.7 percent.
And with a 400-basis-point-drop in vacancy the Oscar goes to… the Greenwich/Noho submarket!
Keep your acceptance speeches under 60 seconds.
Richard Perischetti is the vice president of research & marketing at Cushman & Wakefield.


