Stat of the Week: 13.3 percent
By Richard Persichetti January 26, 2016 2:12 pm
reprints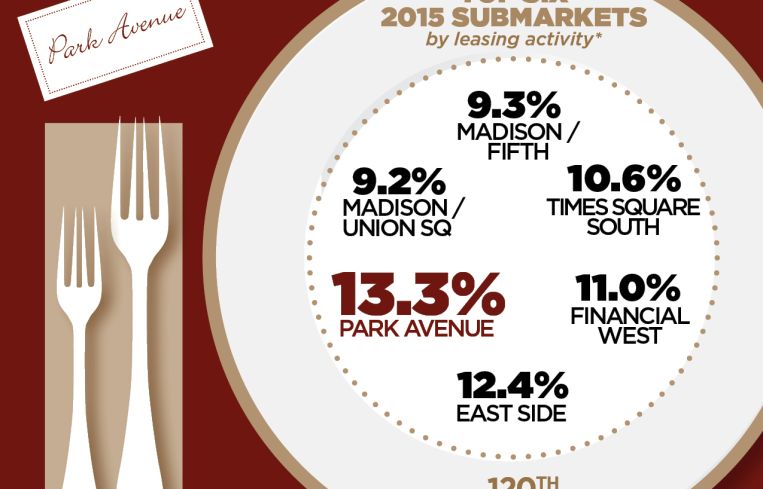
Hello, it’s me. I was wondering after all these years of REBNY banquets if the 120th one would be more special than the rest. In honor of this year’s six honorees (eight if you consider the fact that three members of the Stacom family are being honored), I’ve compiled a ranking of the top six submarkets based on 2015 total leasing activity. The real estate pros who make up this year’s honorees can divide up the markets however they see fit!
To make the comparison even across all 20 submarkets, the ranking is based on total leasing activity as a percentage of total submarket size.
6. Madison/Union Square: This is the only Midtown South submarket to crack the top six. With over 2.9 million square feet leased or renewed in 2015, it accounts for 9.2 percent of its inventory.
5. Madison/Fifth: The first of four Midtown submarkets, Madison/Fifth had over 2.2 million square feet leased or renewed, as leasing activity accounted for 9.3 percent of the total inventory. This helped push vacancy down 210 basis points to 11.6 percent in 2015.
4. Times Square South: This submarket had the second-highest total of leasing activity with over 3.3 million square feet leased—Grand Central had the most leasing activity with 3.6 million square feet leased or renewed but did not make the list due to its market size. Times Square South leasing activity accounted for 10.6 percent of its market size.
3. Financial West: This is the only Downtown submarket on the list. It is also the submarket with the least amount of leasing activity in the top six with only 595,816 square feet leased or renewed, but it was enough to account for 11 percent of the submarket’s inventory.
2. East Side: With just under 2.3 million square feet leased or renewed, it accounted for 12.4 percent of the inventory leased. The Kirkland & Ellis LLP 403,000-square-foot renewal at 601 Lexington Avenue was the largest transaction of the submarket.
1. Park Avenue: A strong leasing year led to a 420-basis-point drop in vacancy in 2015, as over 2.9 million square feet was leased or renewed. This accounted for 13.3 percent of the submarket’s inventory. In addition, it had the highest year-over-year increase in new leasing activity in 2015 by 91.6 percent.


