For commercial real estate and commercial mortgage-backed securities investors, brokers and lenders trying to separate signal from noise in a choppy market, granularity is everything. CRED iQ‘s July 2026 reporting period data looks to provide exactly that with a loan-level view of distress across the $600 billion-plus CMBS universe, broken out by servicing status, deal type, property type, and metro area.
Three numbers that matter
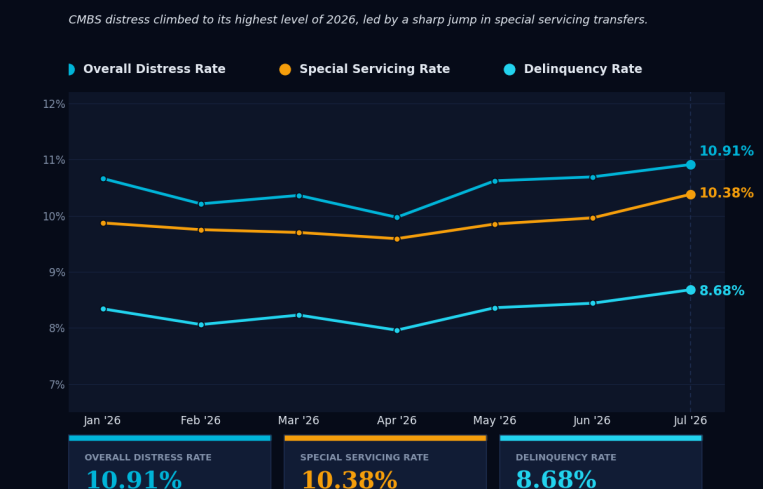
Overall distress rate (10.91 percent): This captures every loan that is either specially serviced or 30-plus days delinquent, the broadest lens on portfolio stress. It has trended upward for three straight months, reversing April’s modest relief (9.97 percent).
Special servicing rate (10.38 percent): This is the more forward-looking indicator, capturing loans referred for workout, modification or foreclosure, often before a formal delinquency shows up. July’s jump of 42 basis points (bps) was the sharpest single-month move of the year.
Delinquency rate (8.68 percent): This measures loans missing payments. Its steadier 24-bps climb shows that while special servicing referrals are accelerating, the pace of loans going truly non-performing is more gradual. The nuance for this stat is visible only when the three metrics are tracked separately rather than blended into one headline.
Why the gap between special servicing and delinquency matters
The widening spread between the two rates is itself a signal. When special servicing outpaces delinquency, loans are typically being transferred proactively, tied to upcoming maturities, cash management triggers, or borrower requests for relief, rather than because payments have already stopped.
CRED iQ’s deal-type data shows conduit and single-asset, single-borrower (SASB) loans behaving differently too: Conduit-sourced delinquent balances outpaced SASB in July, even as SASB’s delinquent share of its own pool stayed elevated.
Where the distress is concentrated
The blended 10.91 percent headline masks real dispersion by property type. Office is the clear outlier at a 16.65 percent distress rate, roughly 53 percent above the market-wide average, with special servicing, not just missed payments, driving the sector’s stress. Mixed-use (13.01 percent) and multifamily (11.21 percent) also run above the blended rate, while industrial (2.35 percent) and self-storage (0.28 percent) remain the healthiest major property types by a wide margin.
Distress is similarly uneven across metro areas. A handful of large markets, concentrated on the West Coast and in the Midwest, are running distress rates more than double the national average, driven almost entirely by special servicing activity rather than outright delinquency. Other major metros remain comfortably below 3 percent. That spread is the point: A single national number tells CRE and CMBS professionals almost nothing about which specific markets carry the risk.
Why granularity wins
Headline distress figures are useful for a quick read, but pricing risk, structuring a bridge loan, or advising a special servicer client requires more. CRED iQ tracks these metrics down to the individual loan, property type, metropolitan statistical area and servicer, letting users isolate exactly where stress is building instead of relying on a single blended rate.
For CRE investors, brokers and lenders who need to move from headline to loan-level insight in seconds, CRED iQ’s data and analytics platform is built precisely for that job, turning CMBS surveillance data into decision-ready intelligence.
Liam Mulcahy is a senior product manager for CRE data and applied AI at CRED iQ.