It’s Summer! Here’s the Hottest Markets and Submarkets
By Richard Persichetti June 21, 2018 11:59 am
reprints
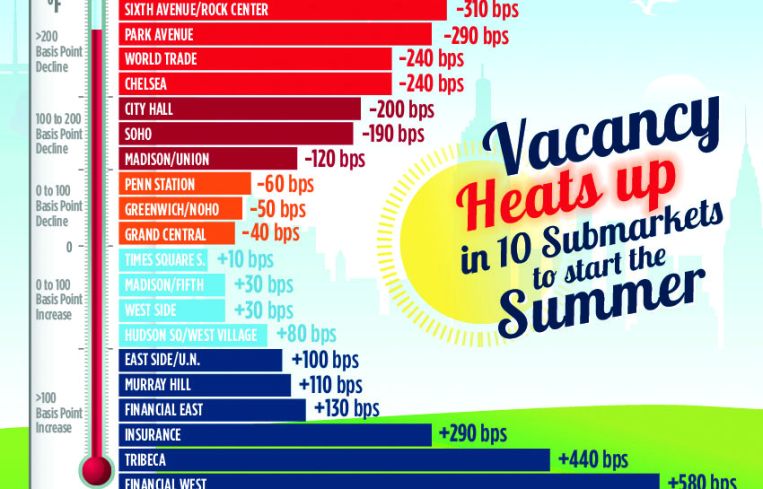
The first official day of summer is quickly approaching, and as the weather starts to really heat up, let’s take a look at the hottest submarkets and examine which ones had the most scorching changes in vacancy over the past year.
Below Freezing: >100-basis-point increase
Financial West: +580 bps to 18.6%
Tribeca: +440 bps to 5.5%
Insurance: +290 bps to 11.7%
Financial East: +130 bps to 9.5%
Murray Hill: +110 bps to 8.0%
East Side/U.N.: +100 bps to 8.6%
This category unfortunately has six submarkets where vacancy jumped at least 100 basis points, with four Downtown and two Midtown. The four Downtown submarkets had the largest increases in vacancy, with the Financial West vacancy rate skyrocketing by 580 basis points to 18.6 percent—the highest of all submarkets. And although Tribeca vacancy jumped 440 basis points year-over-year to 5.5 percent, it is still the third-lowest rate of the 20 submarkets.
A Bit Chilly: 0 to 100-basis-point increase
Hudson Square/West Village: +80 bps to 10.4%
West Side: +30 bps to 8.3%
Madison/Fifth: +30 bps to 12.0%
Times Square South: +10 bps to 8.0%
Supply in these submarkets slightly outpaced demand over the past year, as three submarkets from Midtown and one in Midtown South had vacancy increases. Hudson Square/West Village had the largest increase in this group, up 80 basis points from one year ago to 10.4 percent.
Heating Up: 0 to 100-basis-point decline
Grand Central: -40 bps to 11.1%
Greenwich/NoHo: -50 bps to 2.7%
Penn Station: -60 bps to 7.4%
These three submarkets, two from Midtown and one from Midtown South, turned up the heat over the last 12 months as vacancy declined. Demand in Penn Station remains robust, as this submarket stays hot and leads this group with a 60-basis-point decline to 7.4 percent.
Mid to High 80s: 100- to 200-basis point decline
Madison/Union Square: -120 bps to 5.7%
SoHo: -190 bps to 9.2%
City Hall: -200 bps to 4.8%
The three submarkets in this category are hot, as two in Midtown South and one Downtown posted significant decreases in vacancy. City Hall posted the largest vacancy decline, down 200 basis points to 4.8 percent—the lowest rate in more than two years.
95 Degrees & Humid: >200-basis-point decline
Chelsea: -240 bps to 6.6%
World Trade: -240 bps to 8.5%
Park Avenue: -290 bps to 9.9%
Sixth Avenue/Rock Center: -310 bps to 8.1%
The remaining four submarkets—two in Midtown, one in Midtown South and one Downtown—are on fire with demand significantly outpacing supply. Sixth Avenue/Rock Center takes home the prize of the hottest submarket over the last 12 months, as its vacancy rate plummeted 310 basis points to 8.1 percent. Meanwhile, demand has been strong in the World Trade submarket over the past year, but vacancy will likely increase as the newly constructed 3 World Trade Center enters statistics. Chelsea and Park Avenue round out the group, both recording strong dips in vacancy rates—Chelsea reaching the lowest level in 16 months, and Park Avenue attributing its drop to a space commitment by J.P. Morgan Chase.


