Stat of the Week: 36 Percent Reduction
By Richard Persichetti June 7, 2017 4:54 pm
reprints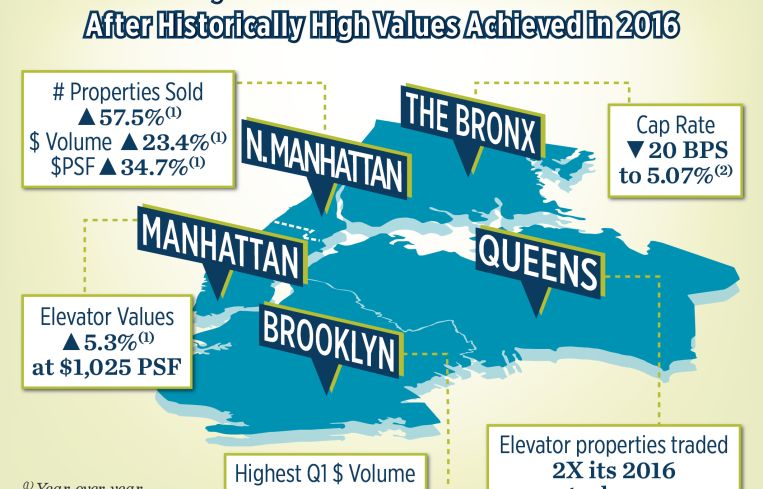
New York City multifamily investments are off to a slow start in 2017 after recording historically high values and 10-year low cap rates in 2016. The multifamily sector has recorded a larger than average decline in number of properties traded and dollar volume this year due partially to buyer-seller pricing disagreement and a maturing stage of the cycle. Activity has also been hindered by weakening fundamentals over the past two years as rents have fallen, concessions have risen and supply has soared.
Through the first quarter, only 291 multifamily properties traded, representing a 36 percent reduction in sales volume compared with one year ago. The significant dip led to a 55.9 percent decline in dollar volume year-over-year, with only $1.7 billion of investments. That figure marks the lowest quarterly total in New York City multifamily sales since the second quarter of 2013, which can be partially attributed to the lack of numerous big-ticket transactions compared with recent years. Cap rates throughout the city for all product types are up in 2017, and multifamily is no exception, as rates increased 21 basis points to 4.51 percent since year-end 2016. Although there was a slowdown in dollar and property volume and an increase in cap rates, multifamily property values remain near the all-time high with a $432 per square foot average, up 6.8 percent from one year ago.
Despite weak aggregate totals for New York City multifamily sales, bright spots emerged within each market during the first quarter.
The Bronx. The only market with cap rate compression to start 2017, down 20 basis points to 5.07 percent.
Brooklyn. Despite that, dollar volume is down 27.5 percent compared to its 2016 quarterly average. Brooklyn recorded the highest dollar volume total in the first quarter at $511.2 million.
Manhattan. Elevator property values continue to increase and are up 5.3 percent year over year to $1,025 per square foot.
Northern Manhattan. This market was the star of the first quarter, as it was the only one with year-over-year increases in both sales and dollar volume—up 57.5 percent with 63 properties sold and 23.4 percent with $441.6 million traded, respectfully. Additionally, this market also had the highest increase in the average price per square foot from one year ago—up 34.7 percent to $558.
Queens. With 26 elevator apartment properties traded in the first quarter, the market more than doubled its 2016 quarterly average.


