Stat of the Week: 6.6 Runs
By Richard Persichetti July 22, 2016 4:02 pm
reprints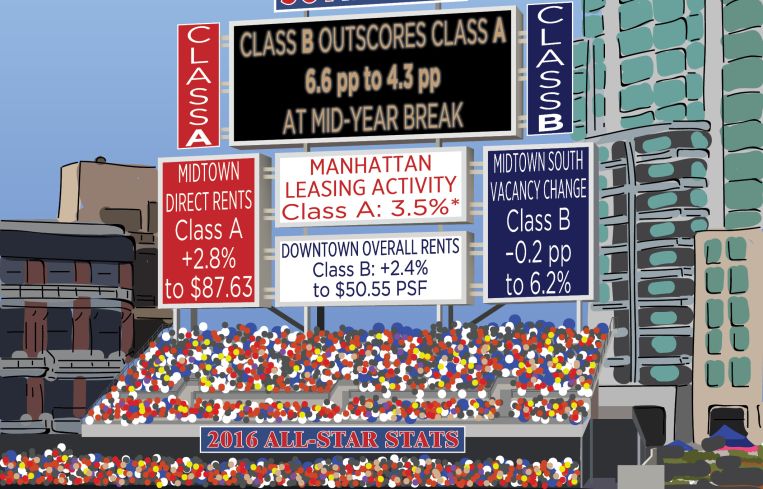
For only the third time in my life, a New York Mets manager is coaching the National League All-Star team. So, in honor of this epic Mets event—yes, I know Yankee fans take this for granted—it’s time for a Major League Baseball All-Star game-themed Stat of the Week.
Rather than pitting the American League against the National League, this All-Star game will be Class A versus Class B statistics throughout the market and based on how things have fared through the first half of the year.
The first two innings will be based off of the percent change in Midtown direct average asking rents. Midtown Class A direct asking rents ended 2015 at $85.25 per square foot and increased 2.8 percent to $87.63 through mid-year 2016. Midtown Class B direct asking rents increased as well, but only 0.8 percent to $61.98 per square foot.
The next two innings are based off of Midtown South’s vacancy rate percentage point change. Class A vacancy increased 0.5 percentage points to 4.5 percent, while Class B vacancy decreased 0.2 percentage points to 6.2 percent. So, for those of you keeping score through the first four innings, the Class A All-Star team has scored 2.3 runs to the Class B team, which only scored 1 run.
Downtown is up next, and this inning is based off of the percent change in overall average asking rents. Class A overall average asking rents declined 1.5 percent since 2015 to $62.24 per square foot, thereby knocking some runs off of the scoreboard for the Class A team. Class B had a strong inning, with an increase of 2.4 percent through mid-year 2016 to $50.55 per square foot.
Headed into the last inning, these runs will be based on new leasing activity through mid-year 2016 as a percentage for Manhattan Class A and Class B total inventory. More than 8.8 million square feet of new leases were completed for Manhattan Class A, which accounts for 3.5 percent of the Class A inventory. Class B had 3.1 million square feet of new leases signed this year, which accounts for 3.2 percent of the Class B inventory.
So, the final score tallies to 4.3 runs for Class A versus 6.6 for Class B, making Class B this year’s mid-year All-Star winner!


