Multifamily Loan Balances Jumped 53% Since 2019
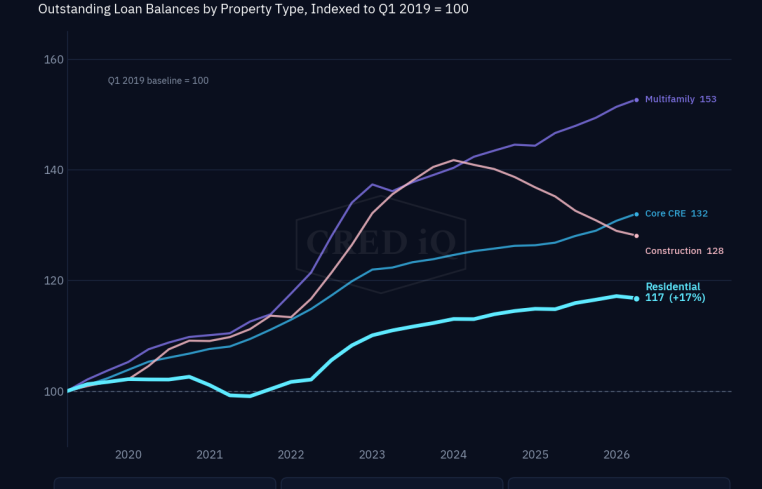
U.S. bank real estate loan balances totaled $6.14 trillion in the first quarter of 2026, according to CRED iQ data. Since the first quarter of 2019, the composition of that real estate loan balance book has shifted measurably.
Multifamily balances grew the fastest in percentage terms, rising about 53 percent, while the much larger residential book grew about 17 percent. In dollar terms the ordering differs, with core commercial real estate and residential each adding more than $440 billion while multifamily added about $229 billion.
As of the first quarter of 2026, multifamily balances stood at an index of 153 (about 53 percent above the 2019 level), core CRE at 132 (roughly 32 percent), construction and development at 128 (around 28 percent), and residential at 117 (approximately 17 percent). Residential, which comprises mortgages on one-family, two-family, three-family and four-family residential properties and home equity, remained the largest category at $3.1 trillion, roughly half of all bank real estate lending, followed by core CRE at $1.92 trillion, multifamily at $665 billion, and construction at $453 billion.
Percentage growth and dollar growth diverge
Growth measured in percent and growth measured in dollars point to different segments. Residential added approximately $445 billion in outstanding balances since the first quarter of 2019 and core CRE added approximately $467 billion, each exceeding the roughly $229 billion added by multifamily, despite multifamily posting the largest percentage gain. The distinction matters for gauging where the largest absolute exposures have accumulated on bank balance sheets, as opposed to where growth has been proportionally most rapid.
Construction and development: a distinct pattern
Among the four categories, construction and development shows the most pronounced change in direction. Indexed to 2019, construction balances rose to a peak near 142 in 2024 before declining into early 2026, ending at 128. This rise-and-partial-reversal pattern is consistent with a period of expanded development lending that has since moderated. It is specific to the post-2019 window and is not evident in longer time series that are shaped by the sector’s post-2008 contraction and recovery.
Methodology and definitions
Balances reflect outstanding loans held by FDIC-insured institutions and exclude loans originated and sold into secondary markets. A substantial share of newly originated one- to four-family mortgages is securitized rather than retained on bank balance sheets, which is one factor behind residential’s comparatively modest balance-sheet growth relative to origination activity. Property-type categories follow standard bank regulatory classifications: nonfarm nonresidential (core CRE), multifamily residential, construction and development, and one- to four-family residential plus home equity (residential). Index values are computed as the ratio of each quarter’s balance to the first-quarter 2019 balance, multiplied by 100.
Mike Haas is the founder and CEO of CRED iQ.