Forbearances, Modifications Carry Weight in Latest Data
By Liam Mulcahy September 1, 2026 9:57 am
reprints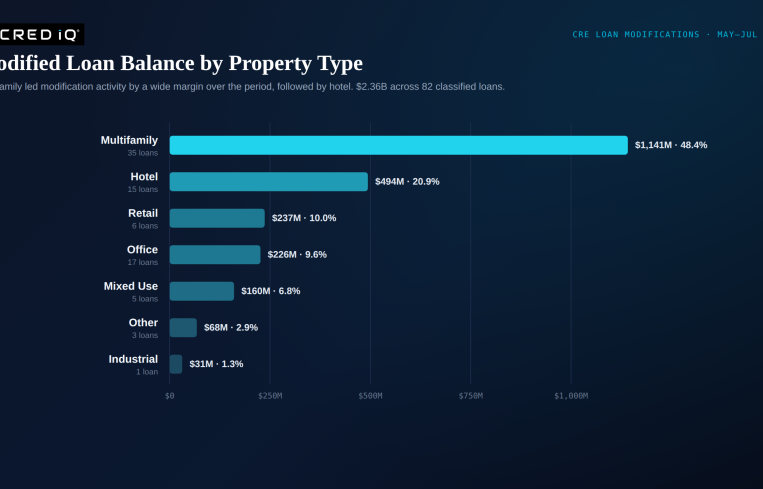
CRED iQ tracked 82 modified commercial mortgage-backed securities (CMBS) and commercial real estate collateralized loan obligation (CRE CLO) loans with a combined $2.36 billion in outstanding balance from May through July 2026. The mix looks different than it did a few quarters ago as “extend and pretend” hasn’t disappeared, but it’s no longer the whole story.
Forbearances and combination modifications are now carrying meaningful weight alongside straight maturity extensions, and the balance is concentrated in midsize loans rather than mega-loans. The property type with the most modifying isn’t hotels or office anymore — it’s multifamily.
Of the $2.36 billion modified during the period, maturity date extensions remained the single largest category: 21 loans totaling $802.5 million, or 34 percent of modified balance (25.6 percent of the loan count). Forbearances followed at 15 loans and $514 million (21.8 percent of balance), while combination modifications — deals pairing an extension with other relief, such as a paydown, rate adjustment or reserve requirement — accounted for 10 loans and $345.6 million (14.7 percent of balance). Of the remaining 36 loans, $695.4 million (29.5 percent of balance) fell into other or miscellaneous modification categories.
Taken together, extensions, forbearances and combination mods — the categories most closely associated with lenders buying time on distressed collateral — made up 70.5 percent of modified balance this period, down from the near-universal “extend and pretend” theme of recent reports. Lenders appear to be reaching for a broader tool kit than a simple maturity push.
Multifamily loans led modification activity by a wide margin, a shift from the hotel- and office-driven distress of previous quarters:
Multifamily: 35 loans totaling $1.14 billion (48.4 percent of modified balance)
Hotel: 15 loans totaling $493.8 million (20.9 percent)
Retail: Six loans totaling $236.7 million (10 percent)
Office: 17 loans totaling $226.2 million (9.6 percent)
Mixed-Use: Five loans totaling $160.5 million (6.8 percent)
Other: Three loans totaling $67.6 million (2.9 percent)
Industrial: One loan totaling $31.2 million (1.3 percent)
Multifamily’s rise to the top of the modification table is notable given the sector’s reputation for relative stability earlier in the cycle. Rate resets on floating-rate loans and slower rent growth in oversupplied metros appear to be catching up with borrowers who underwrote to more favorable financing conditions. Hotel remains a source of distress, at roughly one-fifth of modified balance. Office, long the poster child for CRE distress, accounted for less than 10 percent of modified balance this period — a smaller share than either multifamily or hotel.
Modifications by loan size
Unlike the prior report, where loans of $100 million or more drove the bulk of modified balance, midsize loans dominate this period:
Less than $10 million: 16 loans totaling $28.8 million (1.2 percent)
$10 million – $20 million: 18 loans totaling $275.1 million (11.7 percent)
$20 million – $50 million: 38 loans totaling $1.22 billion (51.7 percent of modified balance)
$50 million – $100 million: Eight loans totaling $554.3 million (23.5 percent)
$100 million plus: Two loans totaling $280.0 million (11.9 percent)
Loans of $50 million and above make up 35.4 percent of modified balance, but the majority of activity — both by count and by dollars — now sits in the $20 million to $50 million range. The average modified loan balance was $28.7 million. The median was $23.1 million, reinforcing that this period’s distress is showing up in the broad middle of the market rather than in a handful of trophy-asset workouts.
The May-to-July 2026 data points to a modification landscape that’s broadening rather than concentrating. Multifamily has overtaken hotel and office as the property type generating the most modification activity, a reminder that distress rotates across sectors as financing conditions and local fundamentals shift. The loan size distribution has also flattened: Rather than a small number of massive loans accounting for most of the dollar volume, midsize loans in the $20 million to $50 million band now carry the largest share of modified balance. And the modification tool kit itself looks more varied, with forbearances and combination structures closing the gap on the maturity extensions that once defined “extend and pretend.”
None of this means distress has eased — $2.36 billion in loans needed some form of relief over three months, and more than 70 percent of that balance came in the form of extensions, forbearances or combination modifications built to buy borrowers time. But the shape of that distress has changed, and lenders and borrowers alike appear to be working from a wider set of options than a maturity date extension alone.
Liam Mulcahy is senior product manager for CRE data and applied AI at CRED iQ.